
Dashboard indicators are structured into grids, charts and boxes and provide information regarding metal prices, payments, customer balances, job orders, etc. The Dashboard is comprised of the following seven grids and charts:
Market prices
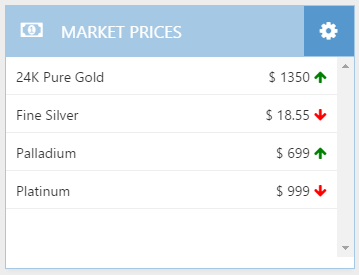
The Market prices grid displays the latest market prices available in PIRO Fusion for pure metals, which are handled as current market prices. Market prices are used to calculate the current prices of item types having market based pricing set up and which include metals. Next to the metal prices, the arrow icons indicate whether the metal price has increased ( ) or decreased (
 ).
).
Metal prices can be set up and managed from the Inventory module’s Metal prices form.
Market prices
The ![]() icon can be used to bring up the Market prices’ Settings form, containing information about the dates of the available market prices. Navigating back to the Market prices grid can be done using the
icon can be used to bring up the Market prices’ Settings form, containing information about the dates of the available market prices. Navigating back to the Market prices grid can be done using the ![]() button.
button.

Market prices – Settings
Jobs in workstations
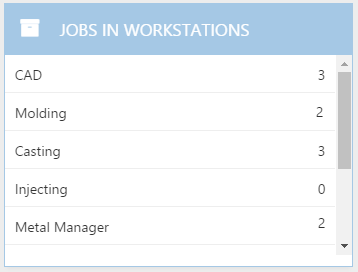
This list displays information about the number of job orders currently being handled in particular work areas. Work areas represent physical workstations and can be set up from the Service tools menu. When creating a new service type, the work area where the service is being processed or performed must also be specified. Based on the job orders’ current service, this information is then used to generate the Jobs in workstations list.
Jobs in workstations
Messages

Messages
Aging list
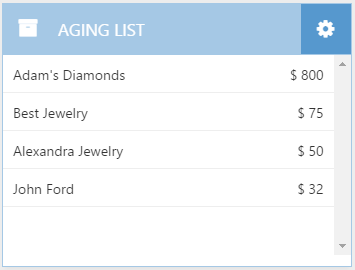
The Aging list shows the total amount from unpaid invoices, or total remaining balance, per customer.
Aging list
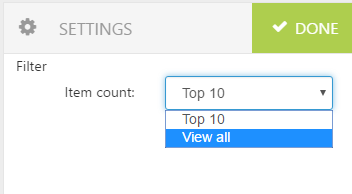
The Aging list includes a Settings form, accessible using the ![]() icon, which allows adjusting the number of results displayed in the list. The list can be set to display the Top 10 customers and their invoice balances, or it can show the information for all customers.
icon, which allows adjusting the number of results displayed in the list. The list can be set to display the Top 10 customers and their invoice balances, or it can show the information for all customers.
Aging list – Settings
Payments
The Payments table contains information about the customers’ payments, which can be filtered based on a time interval. The following information is displayed: the customer, the payment date, payment amount and the payment type. Payments can also be made in installments, until the total value of the invoice is paid. As such, the Payments list may contains multiple entries for the same customer.
The Payments grid is limited to 4 rows per page, and customer payments may be displayed on multiple pages. Navigating between pages can be done using the arrows from the bottom of the table.
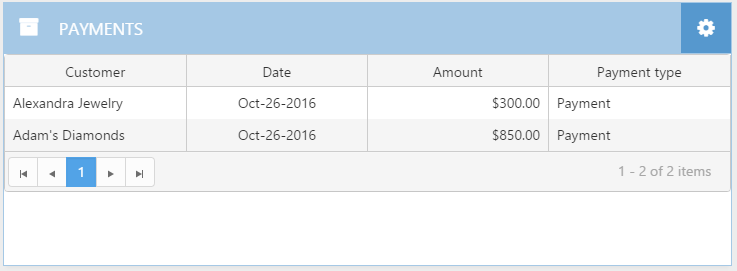
Payments
The Payments grid includes a Settings form, accessible using the ![]() icon. The form allows specifying the time interval of the payment report, so that the payment data is retrieved from this period.
icon. The form allows specifying the time interval of the payment report, so that the payment data is retrieved from this period.
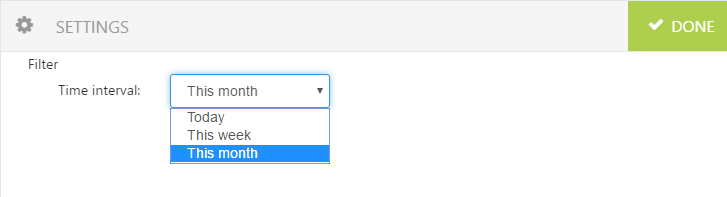
Payments – Settings
Jobs on hold / Jobs in progress
This chart displays information about Job orders in On hold status and Job orders that are currently in progress. The chart displays the ratio between the Jobs On hold and Jobs in progress.
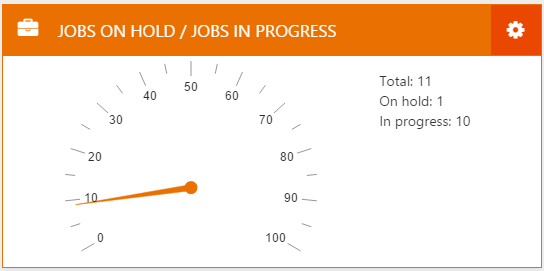
Jobs on hold / Jobs in progress
The list of On hold jobs can be also displayed by switching to the chart’s Settings form through the ![]() button and ticking the Jobs on hold details option.
button and ticking the Jobs on hold details option.
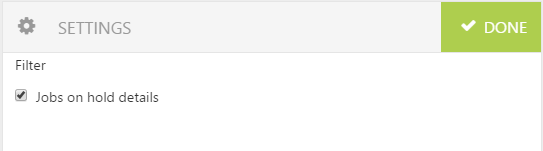
Jobs On hold / Jobs In progress – Settings
After hitting the ![]() button, the chart switches to a grid where information about Jobs on Hold can be overviewed. These details include the order code, service name, the On hold status reason, etc.
button, the chart switches to a grid where information about Jobs on Hold can be overviewed. These details include the order code, service name, the On hold status reason, etc.
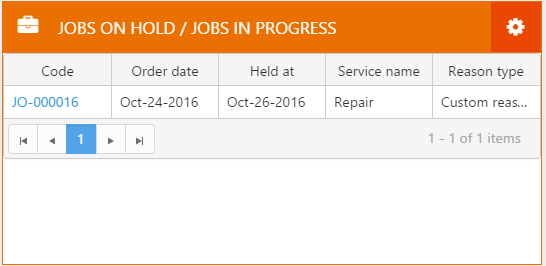
Jobs On hold
Unchecking the Jobs on hold details option from the Settings form switches back to the Jobs in Progress table.
Delayed job orders
This chart displays information about delayed job orders, which are jobs that have passed their due date. The total number of delayed jobs and the number of job orders that are not delayed is given as well. The chart also shows the ratio between delayed jobs and total job orders.
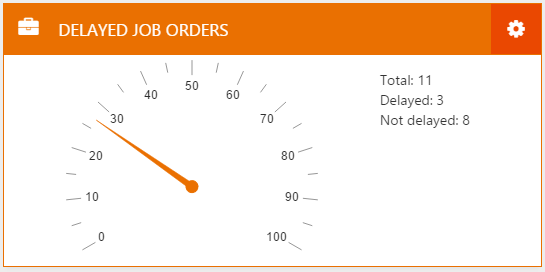
Delayed job orders
A list of delayed jobs can be accessed from the chart’s Settings form by using the ![]() button and ticking the Delayed job order details option.
button and ticking the Delayed job order details option.
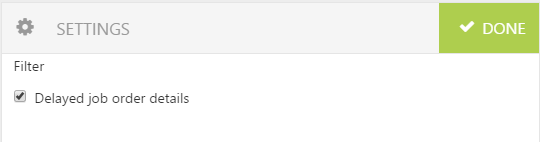
Delayed job orders – Settings
After using the ![]() button, the chart switches to a grid where information regarding delayed jobs may be overviewed, such as the job code, order date, due date, service name and the delay.
button, the chart switches to a grid where information regarding delayed jobs may be overviewed, such as the job code, order date, due date, service name and the delay.
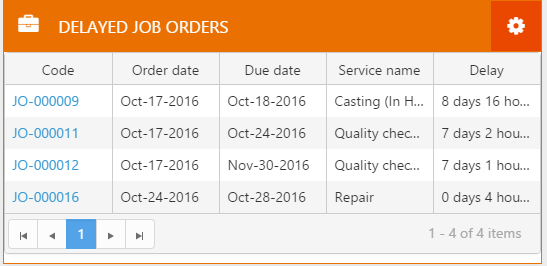
Delayed jobs
Switching back to the original chart can be done from the Settings form by unchecking the Delayed job order details option and hitting the Done button.