
Dashboard
The Dashboard is a visual interface that facilitates access to vital business indicators and helps managers and users answer questions such as:
- Is my shop falling behind its obligations? Are we delivering before or after our deadlines?
- Where is the shop losing money? Which services need improvement?
- Where are the bottlenecks today, and if I resolve them now, where will they appear tomorrow?
How to access:
From the navigation bar: Menu / Dashboard
![]()
Having access to these indicators can make the difference between making good profit, just getting by, or even losing money. Best of all, the information presented here is based on real-time data, allowing for immediate and decisive actions if operations start deviating from expectations.
The PIRO Fusion Dashboard presents a range of indicators along with relevant action options, such as opening the Job queue, routing a job, or adding records like job orders, sales orders, and price quotes. This ensures that the dashboard is not just an informational tool but also a hub for taking immediate action on daily operational tasks.
In addition, the dashboard is fully customizable at the user level. Each logged-in user can configure their own dashboard layout, and these settings are saved individually. Users can:
- Arrange, resize, or hide dashlets (widgets) according to their preferences.
- Enable only the dashlets they wish to see, keeping the interface clean and relevant.
- Create custom report dashlets via the Report builder. This feature allows real-time, fully tailored data to be displayed directly on the dashboard—empowering users to track the exact KPIs and operational metrics that matter most to them.
Through this flexibility, the dashboard adapts to the unique needs of managers, team leaders, or operational staff, providing both visibility and control over critical business information.
Actions
The dashboard’s top section contains a number of buttons designed to perform specific actions. These serve as shortcuts to frequently used forms and dialogs. Access to these actions may depend on the user’s permission level.

- Job queue
Redirects the user to the Job queue page . - Route job
Opens the Route job scan dialog, where the user can scan (or manually type) a job number. Once scanned, the job will be routed. - Add job order
Redirects to the Add new job order detail form. - Add sales order
Redirects to the Add new sales order detail form. - Add to inventory
Redirects to the Add inventory item form. - Add PO
Redirects to the Create purchase order form. - Add Invoice
Redirects to the Create invoice detail form. - Add Price Quote
Redirects to the Create price quote form. - Add OC
Redirects to the Create outgoing consignment form. - Add Customer
Redirects to the Create customer form. - Add item type
Redirects to the Add item type form. - Timekeeping
Opens the Timekeeping dialog.Note: The Timekeeping dialog is not the same as the Timekeeping form.
View modes
The dashboard can be displayed in three different view modes, each determining how dashlets are arranged on the screen:
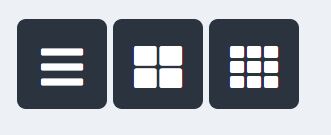
- Wide view
Dashlets are rearranged into a single-column list, with one dashlet per row. - Medium view
Dashlets are arranged into two columns, with two dashlets per row. - Narrow view
Dashlets are arranged into three columns, with three dashlets per row.
Important note: Switching between view modes will override the current dashboard layout. Any existing customizations regarding dashlet position or size will be reset.
Once a default view mode is selected, the user can further customize the dashboard by adjusting which dashlets are visible.
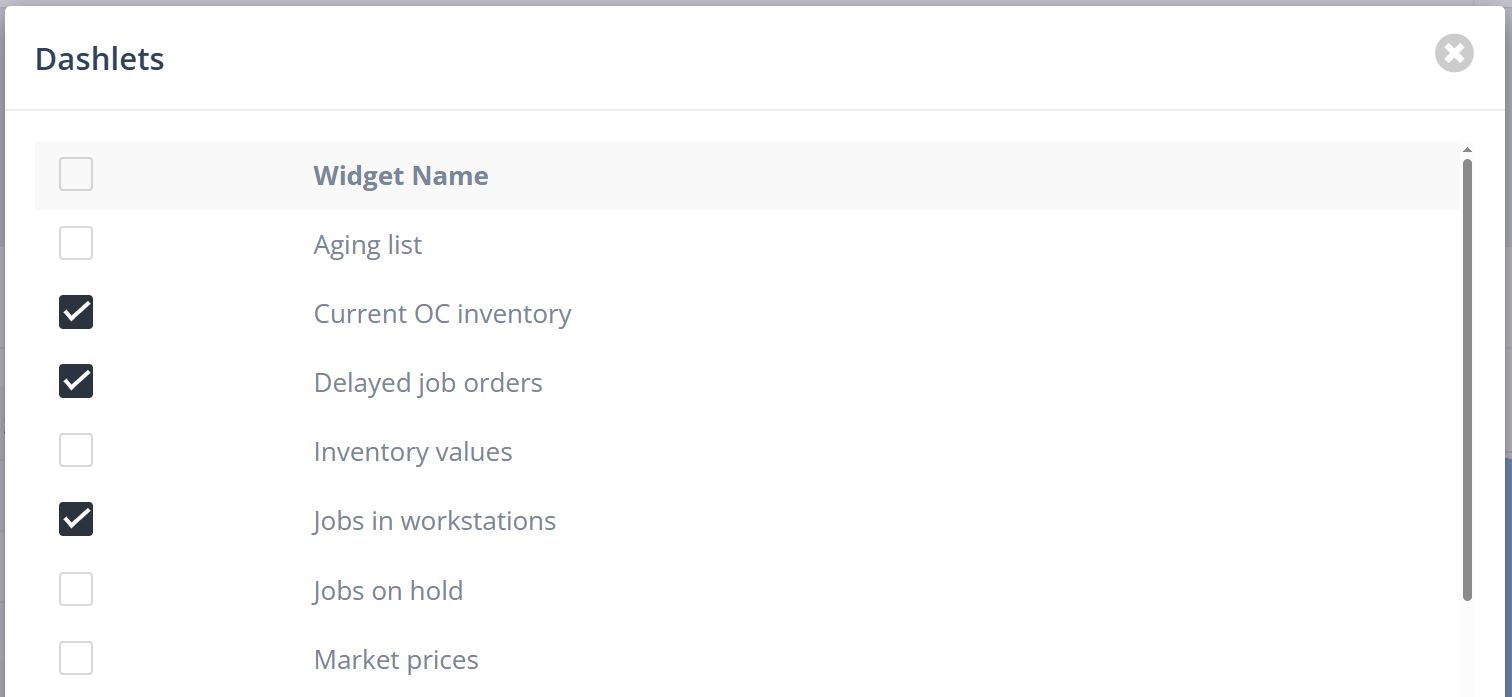
On first login, the dashboard is empty. Users can enable default dashlets by clicking the Cogwheel (Configure dashboard) ![]() icon. This opens the list of all available dashlets, where users can enable or disable visibility according to their needs.
icon. This opens the list of all available dashlets, where users can enable or disable visibility according to their needs.
Editing Dashlets Size and Position
Dashlets can be rearranged and resized using the Pencil (Edit dashboard layout) icon. This allows users to fully customize their dashboard layout to match their workflow.
Rearranging dashlets
- Click the Pencil (Edit dashboard layout)
 icon to enter edit mode.
 - Drag and drop dashlets to any desired position on the dashboard.
Resizing dashlets
- Hover over a dashlet to reveal the resize arrow icons
 (located at the bottom-right corner of the dashlet).
 - Drag the arrows to adjust the dashlet’s size as needed.
Saving changes
- After rearranging or resizing, it is essential to click the Checkmark (Exit edit mode)
 icon to finalize the layout.
 - If the user navigates away or forgets this step, not all layout modifications will be saved.
Important note: Changing the dashboard view mode (Wide, Medium, or Narrow) will always override any dashlet size and position customizations. Users will need to reapply their adjustments after switching views.
Create New Dashlet Form Details
The Create new dashlet form contains three main elements:
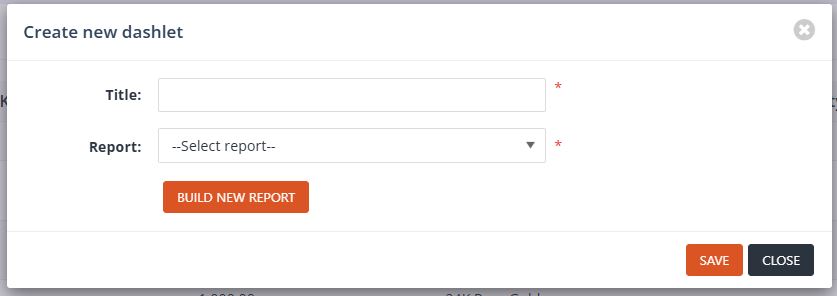
- Title
- The name of the dashlet as it will appear on the dashboard.
- Report
- A dropdown list containing all currently available reports.
- Users must select the desired report to associate it with the new dashlet.
- Build new report
- A button that opens the Report / Report Builder form, allowing users to create a custom report for the dashlet.
Important note: If a report is created using the Report Builder, the user must return to the dashboard and click Create new again. They must then define the dashlet Title and select the newly created report from the Report dropdown to add it to the dashboard.